ISSIMS Logo
  • Home
  • Products
    • SAMMON
    • SIMDAT
    • SIMOPT
    • ARROW
  • News
  • About Us
  • Log In
    Log In page for users of software!
    • Forgot your password?
    • Forgot your username?
    • Create an account
  • Imprint
  • Contact
  • Privacy Policy
ISSIMS logo

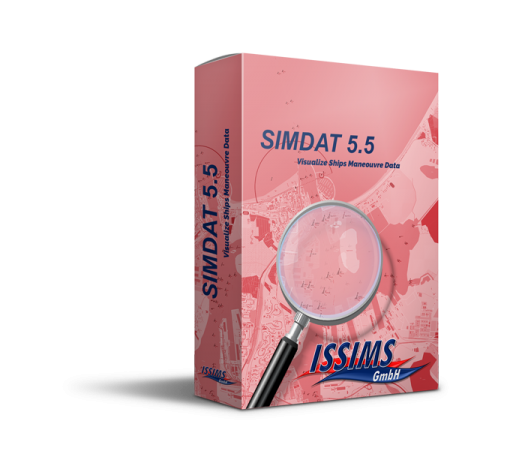
SIMDAT - Visualize Ships Maneouvre Data

SIMDAT - Visualize Ships Maneouvre Data

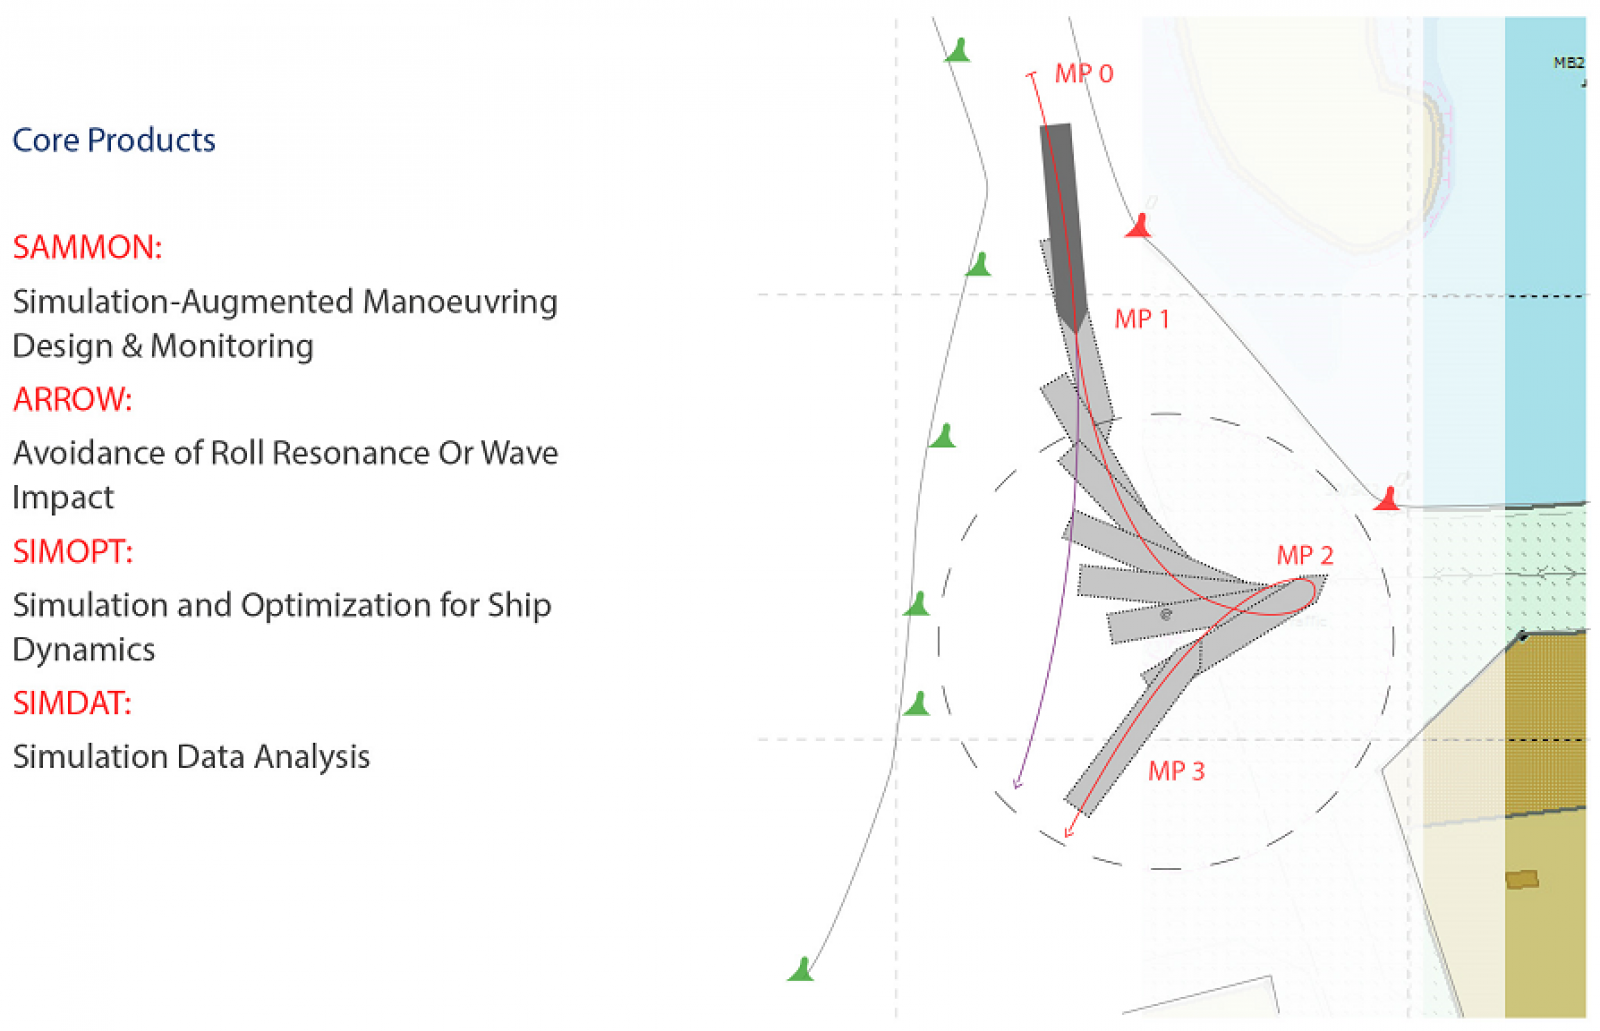
SIMDAT can be used to display, analyze and evaluate data from various simulators - like ANS-Series - and real ships measurement data.

Originally SIMDAT was designed only to display the simulation data from the Advanced Nautical Simulator (ANS) series. It was widely extended and the current version of SIMDAT now can be used to display, analyze and evaluate data from ANS. During a simulator exercise all data can be recorded in full detail to be available for a very extensive analysis by SIMDAT afterwards. The data which can be viewed can comprise any number of simulated manoeuvres and ships. Specifically from SHS exercises it includes own ships, traffic ships, floating object water or floating objects air. For every object the track can be viewed in a geographical or plane coordinate system alternatively. Besides the track of the ships any other simulated or measured data can be displayed and analyzed in comparison to the actual track. In the same way as for the ANS data the SIMDAT program can be used for analysing the results of the SIMOPT (Simulation and Optimization Software). Additionally SIMDAT is ready to display and evaluate the results from measurements with real ships recorded during Ship Manoeuvring Trials.

Full range data sourcing

From ANS-Simulators and SIMOPT results to Ship Manoeuvring Trials - SIMDAT is ready to display and evaluate the full range of data

Maximized Analystics

Compare tracks and data of own ships, traffic ships or floating objects.

Manoeuvre Evaluation

Various data evaluation and assessment methods

SIMDAT Usage & Examples

SIMDAT - Data Main Interface

SIMDAT - Data Main Interface

Maximized track

Maximized track

SIMDAT data comparison

SIMDAT data comparison

SIMDAT data comparison

SIMDAT data comparison

SIMDAT data evaluation

SIMDAT data evaluation

  • SIMDAT - Data Main Interface
  • Maximized track
  • SIMDAT data comparison
  • SIMDAT data comparison
  • SIMDAT data evaluation
  • SIMDAT - Data Main Interface

    The SIMDAT main interface is a combined display for track and parameter information. The upper right part consists of the track display which shows:

    • Track and shapes of own ships used in the simulation
    • Track and shapes of traffic ships used in the simulation
    • Lines between ships if used in simulation

    The tracks can be displayed either in a geographical or in a plane coordinate system. On the right side of the track display a slider allows for scrolling through the data and thus selecting relevant times for analysing the parameter.

    The lower right part of the main interface displays a number of parameter to be analysed. The parameters can either be viewed as sequence over time or as actual value at a certain time. The selection of the parameters is done on the lower left side of the main interface. The upper left side of the interface gives information on the loaded dataset with the number and names of the used ships and track display options.

  • Maximized track

    The track display can be enlarged and can include extracts from an Electronic Chart to give a better visualization of the data. In the track display all objects are presented with the defined shapes according to the dimension of the ship.
  • SIMDAT data comparison

    SIMDAT offers a number of tools to compare data of different types. Fig. 3 and Fig. 4 display the data of a measurement (green) and of two simulations (blue & red). The displayed data include the track and the parameter speed over ground. The blue curves display the state of first tuning approximation and the red curves indicate the final tuning result.

    - SIMDAT comparison of track between measurement data (green) and two stages of parameter tuning (blue – start of tuning and red – advanced level of tuning)

  • SIMDAT data comparison

    SIMDAT comparison of parameter speed over ground between measurement data (green) and two stages of parameter tuning (blue – start of tuning and red – advanced level of tuning)
  • SIMDAT data evaluation

    SIMDAT offers build-in evaluation calculations for a lot of manoeuvres, like turning circles or zig-zag tests in order to extract the characteristic manoeuvring parameters as for instance turning circle diameter, advance and transfer or over swing angles and initial turning parameters from zig-zag tests. In addition calculations to acquire distances to objects from the electronic chart or other ships can be provided to evaluate the performance achieved during the exercise
  • SIMDAT - Data Main Interface
  • Maximized track
  • SIMDAT data comparison
  • SIMDAT data comparison
  • SIMDAT data evaluation

System Requirements - SIMDAT

Minimum system requirements for installation and execution of the SIMDAT software

  • PC with i5-Prozessor or higher
  • 4,0 GB main memory or higher
  • Operating Systems:
    • Microsoft Windows 8.1 (32- and 64-bit)
    • Microsoft Windows 10 (32- and 64-bit)
  • Required disk space for complete installation 250,0 MB
  • CD-ROM-Drive (for installation procedure only), USB or Download
  • Display - Minimum resolution of 1280x1024 pixels
  • Installed Web-Bowser (Internet Explorer, Firefox, Opera, e.g.) to use the SIMDAT-Help program
  • Adobe Acrobat Reader to read the SIMDAT-Manual.pdf a.o.

Downloads - SIMDAT

Filename Size
An Adobe Acrobat file SIMDAT-Kurzbeschreibung_55_de.pdf 1.03 MB
An Adobe Acrobat file SIMDAT-ShortDescription_55.pdf 899.73 KB
A Text file simdat_update_state.txt 74 bytes
  • Home
  • Products
    • SAMMON
    • SIMDAT
    • SIMOPT
    • ARROW
  • News
  • About Us
  • Imprint
  • Contact
  • Privacy Policy